Electrify Chicago
According to the
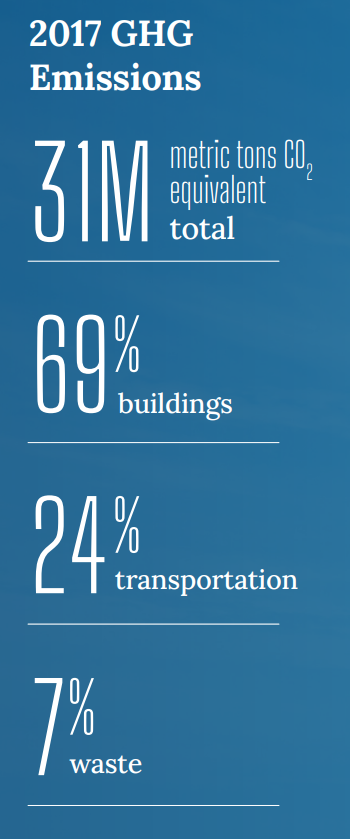
2022 Chicago Climate Action Plan ,
a whopping 69% of Chicago's emissions come from buildings, making it
our biggest challenge and our biggest opportunity as a city to tackle
change. At Electrify Chicago we want to showcase some of the best and worst performing
buildings in the city using publicly available data and manual annotations to add
building photographs and label multi-building owners like universities.
,
a whopping 69% of Chicago's emissions come from buildings, making it
our biggest challenge and our biggest opportunity as a city to tackle
change. At Electrify Chicago we want to showcase some of the best and worst performing
buildings in the city using publicly available data and manual annotations to add
building photographs and label multi-building owners like universities.
You can start by looking at Chicago's buildings with the highest greenhouse gas intensity - this means that they use the most energy when adjusted per unit of square foot, so big buildings could actually perform much better than very inefficient small buildings on this metric.
Chicago Buildings by Greenhouse Gas Intensity
Note: Data only includes large Chicago buildings from 2020
Note: This data only includes buildings whose emissions are reported
under the
Chicago Energy Benchmarking Ordinance. According to the City “As of 2016,
this list includes all commercial, institutional, and residential buildings larger than
50,000 square feet.” This dataset is also then filtered to only buildings with
reported emissions > 1,000 metric tons CO2 equivalent.
This data is also from 2020, but when new benchmark data is available, we'll update the site.
| Property Name / address | Primary Property Type |
Greenhouse Gas Intensity (kg CO2 eq./sqft) |
Total Greenhouse Emissions (metric tons CO2 eq.) |
|---|---|---|---|
|
8890
🚩
345 E Superior St
| College/University | 15.9 kg/sqft
Highest 6%
| 5,879 tons
Highest 6%
|
|
McGowan South
(DePaul)
1110 W Belden
| College/University | 15.8 kg/sqft
Highest 6%
| 2,022 tons
Highest 22%
|
|
Advocate Healthcare Center (Beverly Center)
9831 S Western Ave
| Medical Office | 15.5 kg/sqft
Highest 6%
| 919 tons
Highest 48%
|
|
Shirley Ryan AbilityLab
🚩
355 E ERIE ST
| Hospital (General Medical & Surgical) | 15.4 kg/sqft
Highest 6%
| 13,543 tons #40 Highest
|
|
Sullivan Athletic Center
2323 N Sheffield Ave
| College/University | 15.4 kg/sqft
Highest 6%
| 980 tons
Highest 46%
|
|
Astoria Place Living and Rehab
6300 N CALIFORNIA AVE
| Senior Living Community | 15.4 kg/sqft
Highest 6%
| 796 tons
Lowest 46%
|
|
65 E Goethe
65 E GOETHE ST
| Multifamily Housing | 15.4 kg/sqft
Highest 6%
| 1,772 tons
Highest 27%
|
|
POLICE TRAINING ACADEMY
1300 W Jackson Blvd
| Adult Education | 15.3 kg/sqft
Highest 6%
| 2,762 tons
Highest 15%
|
|
Drexel - Avanath
6140 S DREXEL AVE
| Multifamily Housing | 15.2 kg/sqft
Highest 6%
| 1,234 tons
Highest 38%
|
|
Jeffery Plaza
2101 E 71ST ST
| Supermarket/Grocery Store | 15.2 kg/sqft
Highest 6%
| 1,726 tons
Highest 27%
|
|
Belhaven Nursing & Rehabilitation Center
11401 S OAKLEY AVE
| Senior Living Community | 15.2 kg/sqft
Highest 6%
| 1,058 tons
Highest 43%
|
|
311 City Services
2111 W Lexington St
| Office | 15.1 kg/sqft
Highest 6%
| 890 tons
Highest 49%
|
|
3400 N Lake Shore Drive
3400 N Lake Shore Dr
| Multifamily Housing | 15.0 kg/sqft
Highest 6%
| 878 tons
Lowest 50%
|
|
1201 W. Washington
1201 W Washington Blvd
| Office | 14.9 kg/sqft
Highest 6%
| 828 tons
Lowest 48%
|
|
The Peninsula Chicago
108 E Superior St
| Hotel | 14.9 kg/sqft
Highest 6%
| 6,103 tons
Highest 5%
|
Data Source:
Chicago Energy Benchmarking Data