Electrify Chicago
According to the
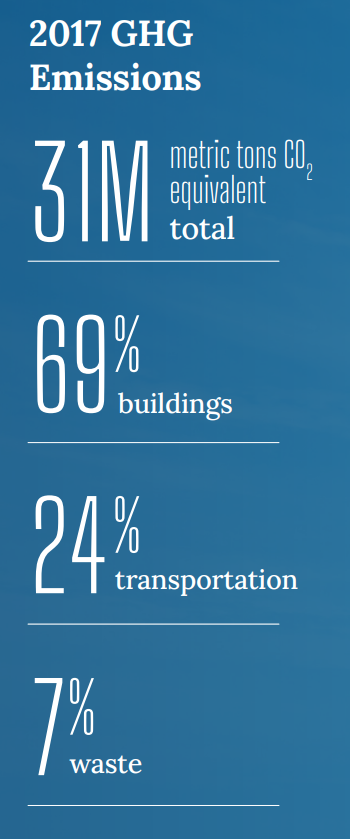
2022 Chicago Climate Action Plan ,
a whopping 69% of Chicago's emissions come from buildings, making it
our biggest challenge and our biggest opportunity as a city to tackle
change. At Electrify Chicago we want to showcase some of the best and worst performing
buildings in the city using publicly available data and manual annotations to add
building photographs and label multi-building owners like universities.
,
a whopping 69% of Chicago's emissions come from buildings, making it
our biggest challenge and our biggest opportunity as a city to tackle
change. At Electrify Chicago we want to showcase some of the best and worst performing
buildings in the city using publicly available data and manual annotations to add
building photographs and label multi-building owners like universities.
You can start by looking at Chicago's buildings with the highest greenhouse gas intensity - this means that they use the most energy when adjusted per unit of square foot, so big buildings could actually perform much better than very inefficient small buildings on this metric.
Chicago Buildings by Greenhouse Gas Intensity
Note: Data only includes large Chicago buildings from 2020
Note: This data only includes buildings whose emissions are reported
under the
Chicago Energy Benchmarking Ordinance. According to the City “As of 2016,
this list includes all commercial, institutional, and residential buildings larger than
50,000 square feet.” This dataset is also then filtered to only buildings with
reported emissions > 1,000 metric tons CO2 equivalent.
This data is also from 2020, but when new benchmark data is available, we'll update the site.
| Property Name / address | Primary Property Type |
Greenhouse Gas Intensity (kg CO2 eq./sqft) |
Total Greenhouse Emissions (metric tons CO2 eq.) |
|---|---|---|---|
|
Twin Towers Apartments LLC
1649 E 50th Pl
| Multifamily Housing | 6.4 kg/sqft
Lowest 49%
| 1,402 tons
Highest 34%
|
|
Sheridan-Gunnison Apts.
4827 N SHERIDAN RD
| Multifamily Housing | 6.4 kg/sqft
Lowest 49%
| 1,047 tons
Highest 43%
|
|
3130 N. Lake Shore Apartments
3130 N Lake Shore Dr
| Multifamily Housing | 6.4 kg/sqft
Lowest 49%
| 1,510 tons
Highest 31%
|
|
Van Buren Park Apartments
2045 W Jackson Blvd
| Multifamily Housing | 6.4 kg/sqft
Lowest 49%
| 1,341 tons
Highest 35%
|
|
623 S Wabash
623 S Wabash Ave
| College/University | 6.4 kg/sqft
Lowest 49%
| 1,312 tons
Highest 36%
|
|
250 South Wacker Drive
250 S Wacker Dr
| Office | 6.4 kg/sqft
Lowest 49%
| 1,611 tons
Highest 29%
|
|
MAM 7301 Sheridan, LLC
7301 N SHERIDAN RD
| Multifamily Housing | 6.4 kg/sqft
Lowest 49%
| 476 tons
Lowest 25%
|
|
Elston Industrial lofts, Llc
1737-1747 N Elston Ave
| Mixed Use Property | 6.4 kg/sqft
Lowest 49%
| 541 tons
Lowest 30%
|
|
29 N Wacker Dr
29 N Wacker Dr
| Office | 6.4 kg/sqft
Lowest 49%
| 884 tons
Lowest 50%
|
|
N002304-CHICAGO (79TH & CICERO) IL
7971 S CICERO AVE
| Retail Store | 6.4 kg/sqft
Lowest 49%
| 742 tons
Lowest 44%
|
|
Bloomingdale Apartments
1745 N KEYSTONE AVE
| Multifamily Housing | 6.4 kg/sqft
Lowest 49%
| 660 tons
Lowest 39%
|
|
3850 W Bryn Mawr
3850 W BRYN MAWR AVE
| Multifamily Housing | 6.4 kg/sqft
Lowest 49%
| 390 tons
Lowest 17%
|
|
THE WATERGATE EAST CONDOMINIUM
5471 S HYDE PARK BLVD
| Multifamily Housing | 6.4 kg/sqft
Lowest 49%
| 350 tons
Lowest 13%
|
|
2912 Condominium Association
2912 2914 N COMMONWEALTH AVE
| Multifamily Housing | 6.4 kg/sqft
Lowest 49%
| 379 tons
Lowest 16%
|
|
Cedar Street Corporation
70 76 E CEDAR ST
| Multifamily Housing | 6.4 kg/sqft
Lowest 49%
| 485 tons
Lowest 26%
|
Data Source:
Chicago Energy Benchmarking Data